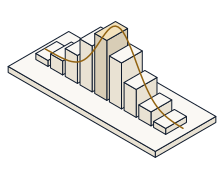
Open the non-parametric sandbox and switch between three preset datasets. Predict — before you read it off the screen — how Spearman's rank correlation ρ compares with Pearson's r on a curved-but-rising cloud, what a single outlier does to each, and how many peaks a kernel density estimate resolves where one fitted normal sees only a bell.
Parametric summaries assume a shape. A non-parametric method does not. Spearman's rho is just Pearson's r computed on the ranks, so it reads only the ORDER of the points: it is near 1 for any monotone climb — even y = x³, where the straight-line r falls short — and a lone outlier that drags r a long way barely moves it, because a rank can only travel one position. Kernel density estimation sums a small bump K of width h over every point, so it can show two humps where the single best-fit normal must smear them into one. Distribution-free, and robust.
Open the sandbox. It opens on the bimodal preset with bandwidth h = 3 and LOESS span 0.5. Each step names the one preset to load from the menu; leave the bandwidth and span at these values unless a step says otherwise.
Preset  ->  cubic / outlier / bimodal   (each step names one)
Bandwidth h  ->  3       LOESS span  ->  0.5       Seed  ->  20260906
Watch three readouts: Pearson r, Spearman ρ and KDE humps. The presets are drawn from a fixed seed, so the numbers you predict are the exact values printed there.
Pick the cubic preset from the menu. Its cloud rises the whole way but bends like y = x³ — strictly increasing, not straight. Predict Spearman's rank correlation ρ, which reads only the ORDER of the points, then read the Spearman ρ readout.
Spearman ρ reads about 0.980 — nearly a perfect 1. Because ρ is Pearson's r on the ranks, it sees only that the climb never turns back, so any monotone increase — including y = x³ exactly, where ρ = 1 — scores near the top.
Stay on the cubic preset. Now predict Pearson's r, the LINEAR correlation, on the very same points — it measures how close they lie to a straight LINE, not merely whether they climb. Read the Pearson r readout.
Pearson r reads about 0.912 — clearly below Spearman's 0.980. The curve is a genuine, tight relationship, but because it bends, the straight-line measure understates it. Rank correlation is the honest summary of a monotone-but-curved link.
Switch to the outlier preset: a clean straight-line relationship with a single point flung far off it. Predict what that lone point does to Pearson's r, then read the Pearson r readout.
Pearson r collapses to about 0.724. Pearson works with the raw distances, so one point far from the line pulls the whole coefficient down hard — a single observation rewrites the summary.
Stay on the outlier preset. Now predict Spearman's ρ on the same data. It reads only each point's RANK, so the outlier is just the largest, one position along. Read the Spearman ρ readout.
Spearman ρ stays high at about 0.981 — the rank correlation hardly moved while Pearson fell to 0.724. Replacing values by ranks caps how far any single point can travel, which is exactly why rank methods are robust to outliers.
Switch to the bimodal preset and leave the bandwidth at its default h = 3. The kernel density estimate sums a small bump over every point; predict how many humps it resolves, then read the KDE humps readout (and note the dashed fitted normal beside it).
The KDE humps readout shows 2. The kernel density estimate resolves both clusters, while the single best-fit normal — forced to be one symmetric bell — has only 1 hump and smears the two together. A non-parametric density shows structure a parametric fit cannot.
Everything above is waiting in the sandbox. Drag the bandwidth h down and watch the bimodal KDE split into more and more spurious humps, then up until it over-smooths back to one; press “Use Silverman’s h” for the data-driven choice; and slide the LOESS span to see a local regression follow a bend a straight line flattens.
- Read Spearman's ρ ≈ 0.980 on the curved cubic preset — near perfect for a monotone climb
- Saw Pearson's r ≈ 0.912 on the same cloud — the straight-line measure understates a bend
- Watched one outlier drag Pearson to r ≈ 0.724
- …while Spearman held at ρ ≈ 0.981 — rank correlation is robust
- Saw the KDE resolve 2 humps where one fitted normal sees a single bell