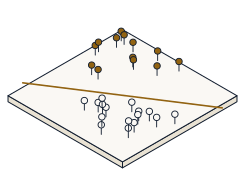
Measure a clustering two ways, find the elbow, then let density label the outliers in the sandbox — and predict, before you read it off the panels, the inertia and silhouette of two far-apart blobs at k = 2, that inertia only falls as k rises, and which DBSCAN points come back as core and which as noise.
K-Means splits data into k groups by minimising the inertia — the within-cluster sum of squared distances to each group's centroid. The silhouette then scores the result in [-1, 1] by comparing how tight a point sits in its own cluster against how far it is from the nearest other one. DBSCAN takes a different view entirely: it grows clusters from dense cores — a point is core when its ε-neighbourhood holds at least minPts points — and leaves the stragglers as noise, so it never needs to be told k.
Open the sandbox. Steps 1–3 run K-Means on the blobs dataset — leave it there and read the inertia, silhouette and k-sweep panels. Steps 4–5 switch the algorithm to DBSCAN: set ε and minPts and watch the core, border and noise colouring.
Algorithm  ->  K-Means      Dataset  ->  blobs      k  ->  2      Seed  ->  7
For steps 4-5  ->  Algorithm: DBSCAN      eps  ->  0.35      minPts  ->  4
The panels show J = ∑ ||x - μ||² (inertia), the mean silhouette s(i), and a k-sweep that plots both against k so the elbow is drawn, not asserted. Under DBSCAN the plot colours every point core, border or noise.
Take the textbook set — five points piled at (0, 0) and five at (10, 0) — and run K-Means at k = 2. Inertia sums the squared distance from each point to its centroid, and each centroid lands exactly on its pile. Predict the inertia, then read the panel.
inertia = 0. Every point coincides with its own centroid, so the within-cluster sum of squares is exactly zero — the lowest any clustering can reach. On real, spread-out blobs it is small but non-zero; zero is the idealized floor.
Score that same k = 2 fit with the silhouette, s_i = (b_i - a_i) / max(a_i, b_i), where a is the mean distance within a point's own cluster and b the mean distance to the nearest other cluster. Here a = 0 and b = 10. Predict the mean silhouette, then read the panel.
silhouette = (10 - 0) / max(0, 10) = 1 — the maximum. Cohesion is perfect and separation is wide. Honest caveat: the silhouette rewards round, well-separated clusters, so a high score confirms compactness, not correctness — a non-convex shape can be clustered correctly yet score low.
Sweep k from 1 to 6 on the blobs and watch the k-sweep panel. Adding a centroid can only shorten some point's distance to its nearest centroid, never lengthen it, so inertia is non-increasing in k. Predict how many times inertia goes up across the sweep, then read the curve.
0 — inertia never rises; it falls steeply until k reaches the true number of blobs (three here), then flattens. That bend is the elbow you pick k at. Note inertia alone always prefers more clusters — which is exactly why you read the elbow, not the minimum.
Switch to DBSCAN with ε = 0.35 and minPts = 4. Take a dense 5×5 grid of points plus one far-away outlier. DBSCAN grows clusters from dense regions and refuses to force stragglers in. Predict the outlier's cluster label, then read the core / border / noise colouring.
The outlier's label is -1 — noise. It has only itself within ε, far below minPts, and it is reachable from no core point, so DBSCAN leaves it out. The grid's interior points each come back as core points in one cluster. This is what K-Means cannot do — it would drag the outlier into a cluster and pull a centroid off true.
Now the sharpest test. Take four points packed inside one ε-ball and look at one of them: its ε-neighbourhood holds itself plus the other three — exactly four points. A point is core when |Nε(p)| ≥ minPts. With minPts = 4, predict whether it is a core point (1 = yes, 0 = no), then raise minPts to 5 and watch.
core = 1 — with 4 ≥ minPts = 4 it sits exactly on the boundary and counts as core. Raise minPts to 5 and the same point drops to non-core (4 < 5), because DBSCAN counts the point itself: the test is ≥, not >. That off-by-one is why the sklearn convention and this demo both include the point in its own neighbourhood.
Everything above is waiting in the sandbox. Drag k and watch the inertia and silhouette panels move, sweep the k-panel to find the elbow, then switch to DBSCAN and turn ε and minPts to see clusters grow from dense cores while stragglers fall out as noise — and try the moons and circles, where DBSCAN follows the shape and K-Means cannot.
- Measured inertia = 0 and silhouette = 1 for two far-apart blobs — the idealized best
- Saw inertia fall monotonically as k rose (0 rises across the sweep) — the elbow you pick k at
- Watched DBSCAN label an isolated point noise (-1) instead of forcing it into a cluster
- Found a point with exactly minPts neighbours is core — the ≥ boundary that flips at minPts + 1
- Every value you predicted is the demo's own K-Means and DBSCAN arithmetic, not a picture