Pose the same hard problem — nonlinear separation — to three model families, then evaluate the winner honestly. Read, before the screen shows it, a greedy decision tree's train accuracy on XOR, a linear SVM's accuracy on a ring, the same SVM's accuracy once an RBF kernel is switched on, and then the precision the confusion matrix reports for the winner.
There is no single best model — only the best model for a given problem. The way to find it is to run several families on the same task and compare. A greedy decision tree splits on one axis at a time, so it stalls on XOR. A linear SVM draws one straight corridor, so it cannot wrap a ring. The same SVM with an RBF kernel bends that corridor and separates the ring perfectly. But a comparison is only as honest as its metric: a single accuracy number hides the two mistakes, so the confusion matrix — precision and recall — is where the comparison must finally be judged.
Open all three sandboxes in tabs. Each step below names one sandbox and the single dataset-and-model choice to make in it; leave every other knob at its default so your numbers match these.
1 Decision tree -> Dataset: XOR, Max depth 1, Gini    2 SVM linear -> Dataset: circle, Kernel: linear, C = 1
3 SVM RBF -> same circle, Kernel: RBF    4 Metrics -> prevalence 0.30, threshold t = 0.50
Read four numbers across the three tabs: the tree's train accuracy on the decision-tree page, the linear and then RBF accuracy on the SVM page, and the precision under the confusion matrix on the metrics page.
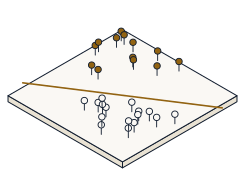
In the decision-tree sandbox set the dataset to XOR and Max depth to 1. On the four-corner XOR opposite corners share a class, so no single axis-aligned cut separates anything and every candidate gain is 0. Predict this family's train accuracy, then read it.
The tree makes no split at all and predicts the majority, so train accuracy = 0.5 — the coin-flip baseline, at any depth. Note this is the greedy learner failing, not the tree model class: a non-greedy or forest search could solve XOR. That is exactly why we compare families empirically. This is the demo's own buildTree / accuracy arithmetic, not a typed number.
Switch to the SVM sandbox, set the dataset to circle — one class inside a ring of the other — and fit the linear kernel at C = 1. No straight line can enclose the inner blob. Predict this family's train accuracy, then read the accuracy panel.
The linear kernel stalls at train accuracy = 0.6556 — barely above guessing the majority — because a single straight corridor cannot wrap a ring. Same task, a different family, and it fails. This is the demo's own trainSVM / accuracy arithmetic, not a typed number.
Keep the same circle dataset — this is a true head-to-head, one task — and switch only the kernel to RBF. The kernel trick maps into a curved feature space where the ring becomes linearly separable. Predict the RBF train accuracy, then read the panel.
The RBF kernel reaches train accuracy = 1 — it separates the ring perfectly, where the same SVM's linear kernel was stuck at 0.6556. Winner of the comparison: not a new model family, but the right inductive bias. This is the demo's own kernel / trainSVM arithmetic, not a typed number.
A winner on accuracy still needs an honest score. In the metrics sandbox, on the opening state (prevalence 0.30, threshold t = 0.50) the confusion matrix reads TP = 273, FP = 74. Overall accuracy here is a flattering 0.899; precision is TP / (TP + FP) — how often a positive prediction is right. Predict precision, then read it.
The precision readout is precision = 273 / (273 + 74) = 0.7867 — well below the 0.899 accuracy, because accuracy is inflated by the easy negatives. Comparing models on accuracy alone would have flattered every one of them; the confusion matrix is what makes the comparison honest. This is the demo's own confusion-matrix arithmetic, not a typed number.
Open all three sandboxes and run the comparison yourself: give the greedy tree XOR and watch it stall, fit a linear then an RBF SVM on the ring and watch the boundary bend, then slide the threshold in the metrics sandbox and watch precision and recall trade off. Same task, different models, one honest score.
A model-comparison report is a table of families, the number each scored, and the metric you trust. Fill in each blank from the sandboxes, then name the winner and one reason. This is the deliverable; there is no number to read off the screen here.
Task ........... nonlinear separation (each sandbox has its own benchmark)
Model A ........ greedy tree, XOR, depth 1 ........ train accuracy ... ______
Model B ........ linear SVM, ring ................. train accuracy ... ______
Model B (RBF) .. RBF SVM, same ring ............... train accuracy ... ______
Winner ......... which family separated its task, and why? ......... ______
Evaluation ..... precision at prevalence 0.30, t = 0.50 ............. ______
Then change one thing — deepen the tree, raise C, switch the SVM dataset, or make the positive class rarer in the metrics sandbox — and note which model now wins and whether precision still agrees with accuracy. That gap between the leaderboard and the honest metric is the whole lesson of the project.